The essence of Tableau Visual Analytics is interactivity, which means it leverages your collaborators with faster insights and flexible design experiences.
Before, Tableau interactivity was aimed at some specific actions. With filter and highlight actions, you can filter sheets and highlight the record in the view. But it was not beneficial if you have to filter calculations or to collectively encode sets of selected spots. Tableau 2018.3 provides the function to ‘Set Actions’ for visually designing multiple effects.
Tableau 2019.2 has parameter actions that extend and facilitate all users to visually adjust the parameter values, which provides the prevailing potential to put up significant visualizations and add interactivity to your work.
So if you are having Tableau Training Classes, do you know parameter actions? Let’s check out below!
How and When To Use Parameter Actions to Extend Interactivity
In Tableau, parameter means constant values that are the key components in analytics scenarios. They are used for calculations, work as reference lines and bands in table calculations and define analytic indicators. Parameters can be used for filtering in a single as well as multiple data sources to optimize live connection queries. These actions lead top interactivity to all other actions.
Create Parameter Action
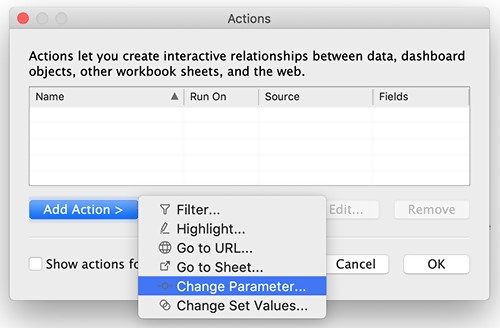
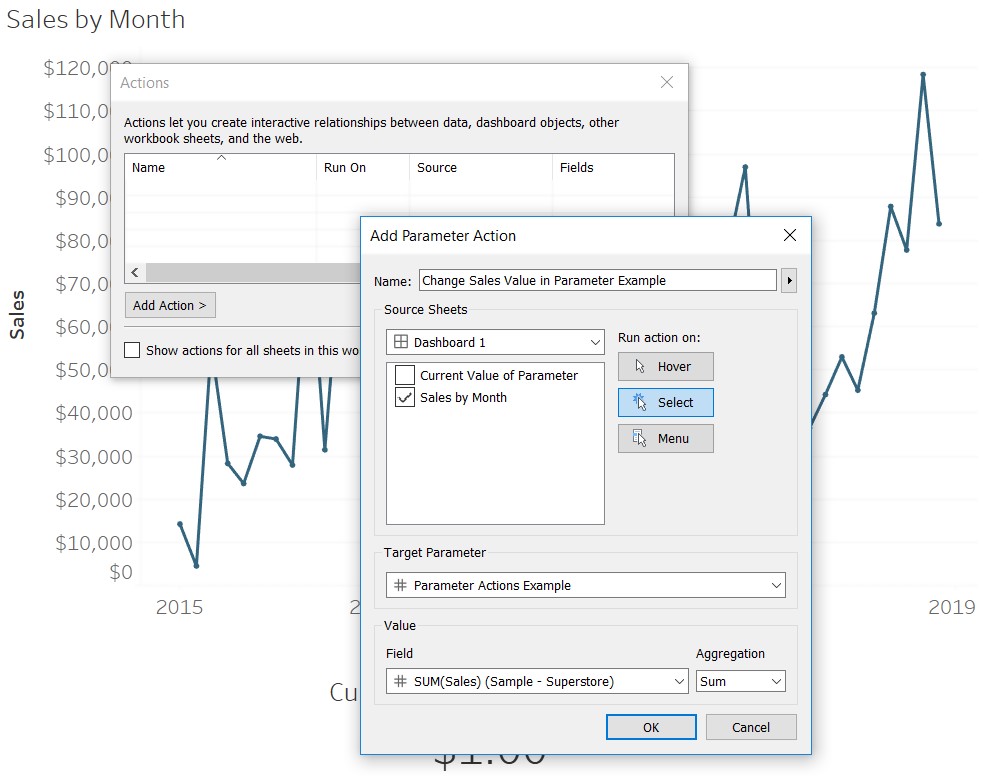
To create a parameter a parameter action, start on with Action Dialog on Dashboard toolbar and select “Change Parameter” option. Choose the source sheets and set off type on the parameter you target to change. You can adopt the aggregation method when multiple values are shown in the view. It returns single values for the parameter easily.
When You Should Use Parameter Actions?
Parameter actions are used to leverage new functionalities to build interactive index charts and to construct influential visual comparisons for specific time intervals for month to month or year to year. Numeric parameters are used to recover static summary statics for your selection. Then you can finally leverage string parameters and build interactive working reports.
Interactive Temporal Analysis
An Index chart is an image that shows you the changes occurred with reference dates in a specific time interval. Reference date may be a particular stock or input purchase date. So you can interactively set these certain dates with the help of parameter actions to make calculations.
Interactive Statistical Analysis
When you want to review contextual synopsis while interacting with clusters and individual columns in the view, this process is burdensome. It involves multifaceted LOD calculations to find the correct results. But with parameter actions, no calculations are required to achieve the anticipated design. You can store your selection in different parameters and then use them later to compose reference lines in histograms existing in the tooltip.
Interactive Spatial Analysis
In spatial visualizations, you can create communicative interactivity with parameter actions. You can use the selected county’s value as the reference parameter and calculate the % difference in rates of actions between the selected time series.
Interactive Conditional Navigation
Parameter values can leverage the results of pivot operations as resource fields. This helps consumers to steer dashboards and conditionally discharge actions of concern.
Interactive Incremental Analysis
Not only pivot operations, but parameter actions also influence calculations as source fields. It doesn’t require any action to replace the current value. It keeps previously used values and includes new ones. So you don’t need to hold keyboard keys down to gather values of interest.
Interactive Customizability
You can synchronize encoding settings across multiple panes of a standard value; parameter actions pick numeric values and do threshold calculations. And a few additional actions keep updating the reference dates and values in a visualization title.
Parameter actions are a valuable tool to build tableau more potential, customized and interactive in a few clicks. Register for Tableau Training Classes to practically learn when and how to use these parameter actions to make your Tableau more interactive. ExistBI provide certified Tableau training in the US, UK and Europe.